
| Time | Content |
|---|---|
| 10:00–10:20 | Tidy data |
| 10:20–10:40 | Exercise 1 |
| 10:40–10:50 | Discuss exercise 1 |
| 10:50–11:30 | Welcome to Tidyverse |
| 11:30–11:40 | Break |
| 11:40–12:10 | Exercise 2 |
| 12:10–12:30 | Pivotting data |
| 12:30–12:50 | Exercise 3 |
| 12:50–13:00 | Wrap up |
Materials
BDSI Workshop

🕙 Schedule
📑 Resources
🏋️♀️ Exercises
From the print handouts (given out in the workshop), discuss with your group about whether the data are organised as tidy data for each spreadsheet. If it is not a tidy data, then how would you organise it so that it is tidy?
Download spreadsheet here.
Reflect on learning objectives
You should be able to:
- Recognize the characteristics of tidy data
- Use the
smartpilldata from themedicaldatapackage to complete Table 1 by filling in the missing values.
| Group | Mean | SD | N |
|---|---|---|---|
| Critically ill trauma patients | |||
| Healthy volunteer |
- Using the
strep_tbdata in themedicaldatapackage, calculate the number of patients in each baseline condition by gender. Using this calculation, fill in the missing values in Table 2.
| Baseline condition | Gender | N |
|---|---|---|
| Good | Female | |
| Good | Male | |
| Fair | Female | |
| Fair | Male | |
| Poor | Female | |
| Poor | Male |
- Using the
aastveit.barley.covsfrom theagridatpackage, calculate the total rainfall for each year and then fill out the missing values in the table below.
| Year | Total Rainfall |
|---|---|
| 1974 | |
| 1975 | |
| 1976 | |
| 1977 | |
| 1978 | |
| 1979 | |
| 1980 | |
| 1981 | |
| 1982 |
Reflect on learning objectives
You should be able to:
- Differentiate between the Base and Tidyverse paradigms
-
Acquire the skills to add/modify columns, subset data by rows and columns, rename column names, and perform group operations using
dplyr
- Transform the
crampton.pigdata fromagridatpackage into the format as shown in Table 3.
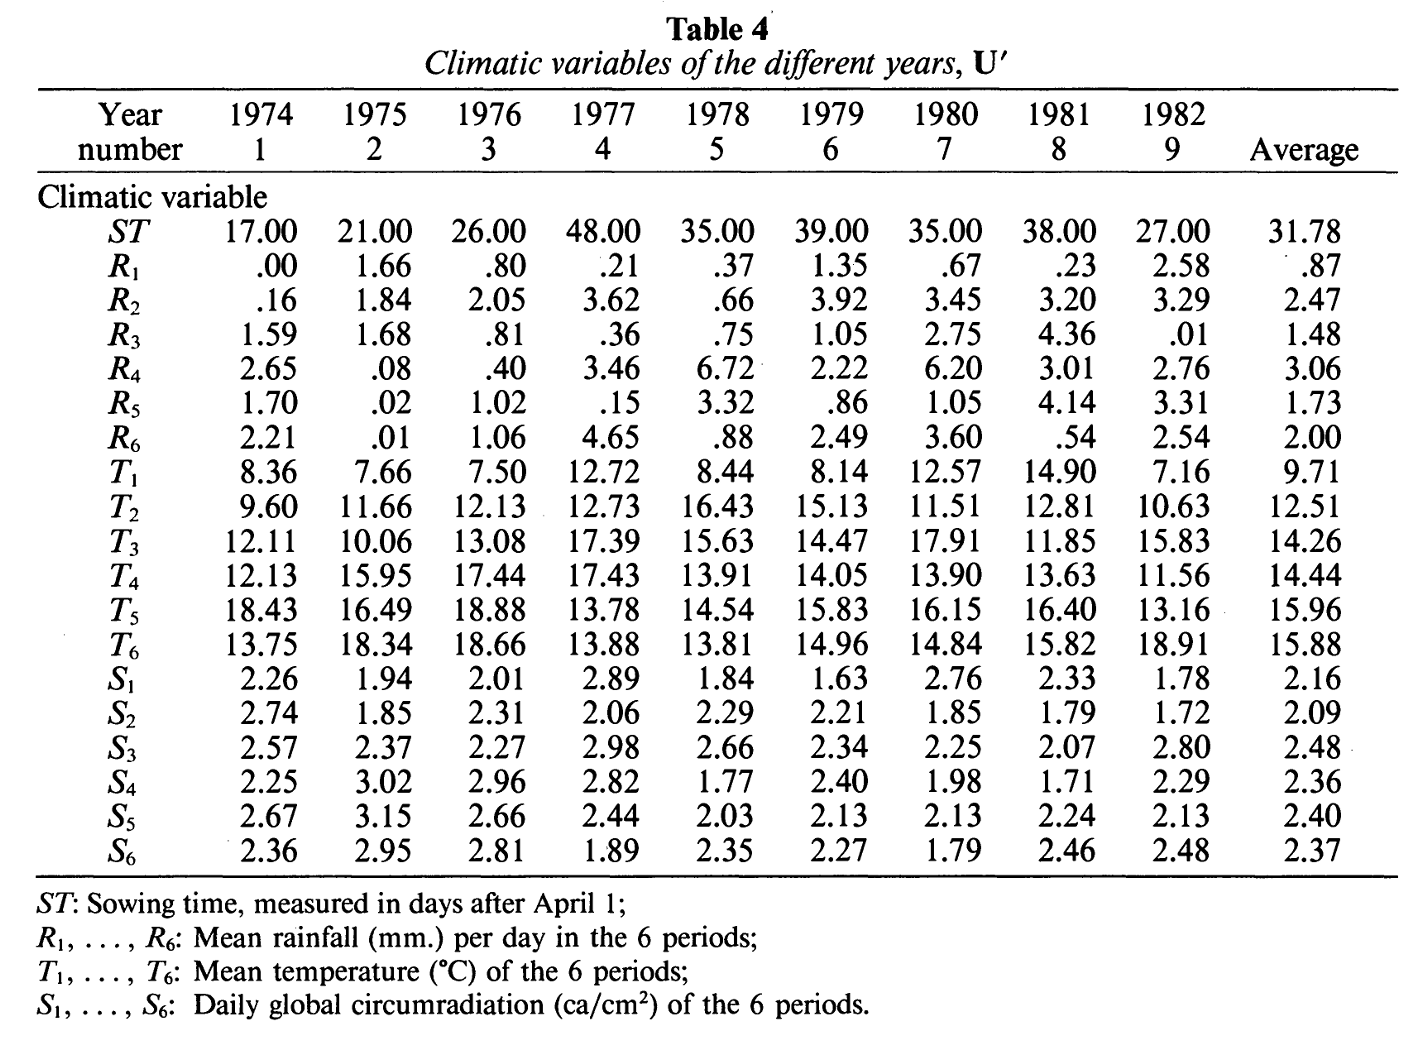
- Figure 1 shows the data contained in
aastveit.barley.covsfrom theagridatpackage. Transform this data into a longer format like in Table 4.
Reflect on learning objectives
You should be able to:
-
Pivot data into longer or wider format using
tidyr
References
Aastveit, Are Halvor, and Harald Martens. 1986. “ANOVA Interactions Interpreted by Partial Least Squares Regression.” Biometrics 42 (4): 829. https://doi.org/10.2307/2530697.